Brea, California, April 8, 2019—Moxa is pleased to announce the release of the latest software update for our industrial network management software, MXview. One of the best features of this software update is that customers can now easily integrate MXview into both IT and OT systems, as well as manage large-scale networks at multiple sites. Furthermore, MXview has a user-friendly interface to help our customers view the network status quickly and conveniently.
Easily Integrated Into IT and OT Systems
MXview supports a web widget that provides a URL for users to integrate MXview into SCADA systems and other web-based applications. In addition to integrating MXview into OT applications, MXview now supports RESTful API, which provides IT engineers with more options to manage and control their industrial networks with their own dashboard to reduce maintenance effort.
Supports Management of Multiple Sites
MXview now offers a centralized monitoring approach for up to 10 different sites that have a maximum of 2,000 network devices per site. “MXview is a scalable network management tool developed to deal with the expanding industrial network requirements of the IIoT,” said Theo Lai, Product Manager at Moxa.
User-friendly Interface
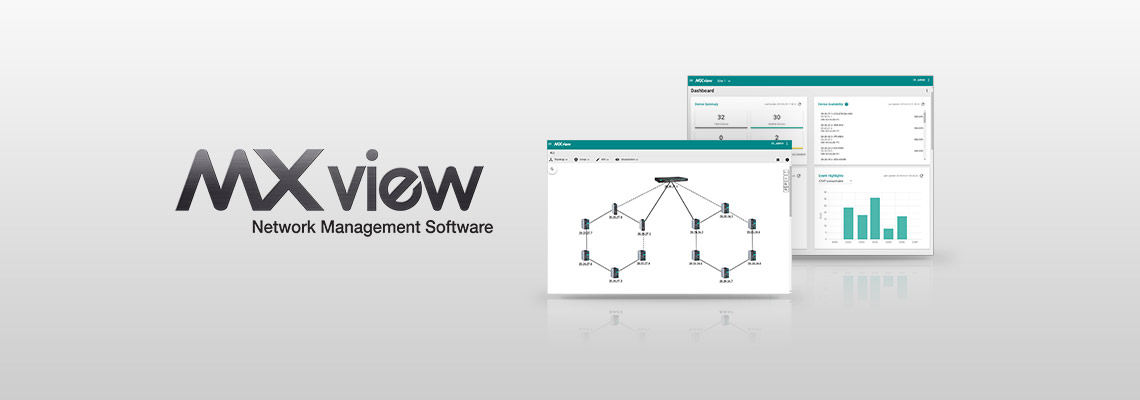
In order to simplify network management, MXview allows users to get the information they require from the main control dashboard. “We developed the latest version of MXview with two goals in mind: to make network management easier and to ensure that the software is easy-to-use,” said Theo Lai. MXview provides a one-page dashboard that allows users to quickly check the status of the network and uses a web-based software design that allows devices on industrial networks to be monitored via a web browser. Furthermore, the interface of MXview supports six languages, including English, Simplified and Traditional Chinese, French, German, and Japanese.
About MXview Industrial Network Management Software
Easily integrated into third-party applications with a web widget and RESTful API interface.
Central management of device monitoring, configurations, and firmware for 10 different sites with 20,000 devices.
The network dashboard provides a convenient way to check the network status.
Discovers and visualizes network devices and physical connections automatically.
Multiple options for events and notifications with self-defined thresholds and durations.
Easy World is Moxa's official distributor in the Middle East. For any further information, please contact us via sales@eworldme.com.

